
7th April, 2026

Most ecommerce operators I speak with are tracking somewhere north of 40 metrics across Shopify, Meta, Google Ads, TikTok and GA4. That's the reality of running a modern DTC brand. Every platform comes with its own native dashboard, every SaaS tool layers on its own KPIs, and somewhere along the way the weekly leadership deck quietly grows from 8 slides to 24.
Here's the uncomfortable part. Of those 40-plus metrics, maybe six or seven are genuinely influencing decisions. The rest are observation, not intelligence. They get reviewed, occasionally discussed, and rarely acted on. That's a signal-to-noise ratio of roughly 6:1, and it has a real cost. Most growth leaders I work with are spending close to an hour a day triaging yesterday's performance across six different platforms. That's 21 hours a month, or about 3.5 working days, spent figuring out what happened instead of planning what to do next.
This piece walks through a structured ecommerce metric audit you can run on your own reporting in an afternoon. The goal is simple: get from 40-plus metrics down to around 12, and make sure every one that survives is genuinely earning its place.
Why this matters more than most operators realise
There's a psychological principle worth grounding this in. In 1956, George Miller published a paper showing that human working memory can handle somewhere between five and nine items at any given time. That's it. Compare that against the 40-plus metrics most brands try to hold in their heads while making budget decisions worth £300K and upwards, and the problem is obvious.
Tracking more metrics doesn't make you more informed. Past a certain point, it actively makes you worse at decision-making, because your attention gets fragmented across signals that don't matter. The person responsible for high-stakes calls on inventory, paid spend and channel mix shouldn't be calculating week-on-week variance across six platforms every morning. They should be looking at a small, focused set of numbers that map directly to the business model.
The vanity metric trap
Part of what's compounded this problem is the prevalence of vanity metrics. Social followers, post likes, impressions, reach, video views. They're all easy to track and they make for clean-looking dashboard tiles. But if your Instagram following grew 15% last month, what does that actually mean for the business? What's the consequence? What decision changes?
The honest answer in most cases is none. We've collectively fallen into the trap of measuring what's easy rather than what drives growth. And part of why that happens is because measuring the stuff that actually matters, joining the dots across platforms, centralising data into one warehouse, analysing changes in proper context, is genuinely difficult. Vanity metrics are the path of least resistance.
The framework: North Star, Drivers, Levers
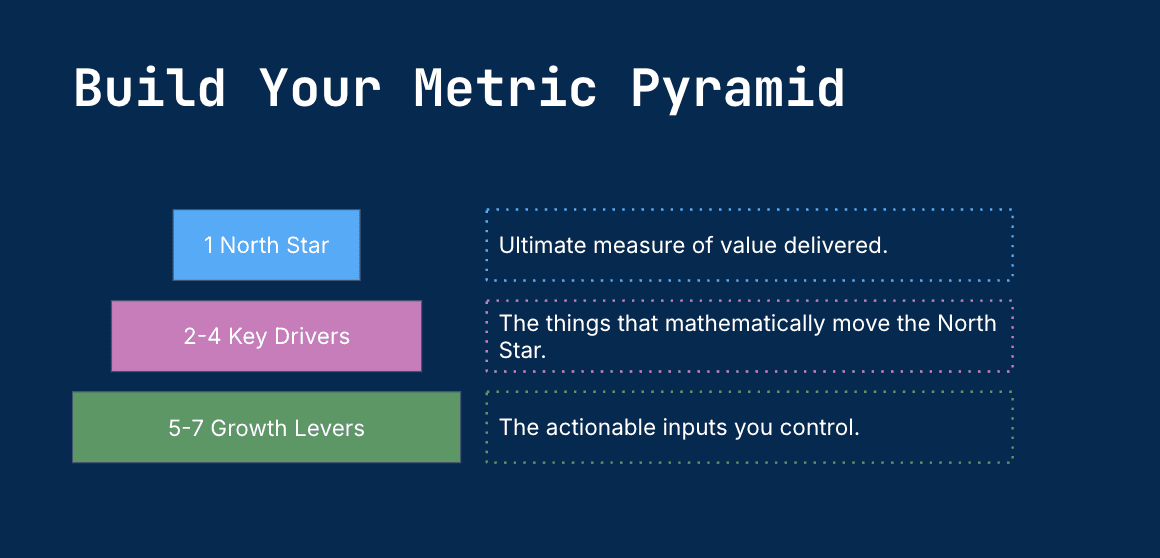
The fix is a structured metric pyramid that forces focus and maps directly to your growth model. It looks like this:
1 North Star Metric. The single ultimate measure of value you're delivering to customers. For most DTC brands this is something close to net revenue, contribution margin, or active subscribers, but it depends entirely on your model.
2 to 4 Key Drivers. The mathematical inputs that form your North Star. Think of these as the equation behind it. If your North Star is contribution margin, your drivers might be AOV, gross margin %, blended CAC and repeat rate.
5 to 7 Active Levers. The operational, actionable inputs your team can directly influence day to day. Number of A/B tests run, email flows optimised, ad creative rotated, new product launches shipped. These are the things people actually do.
That gives you a maximum of 12 metrics in total. One plus four plus seven. It maps cleanly to the bounds of working memory, and it forces every single metric to justify its existence by being either the destination, a mathematical input to the destination, or an action that moves the inputs.
The 5-step ecommerce metric audit
Here's the process to run on your existing reporting.
Step 1: The vanity metric test
Take every metric you currently track and ask three questions of each one.
First, does it help you make decisions? If the metric goes up or down, does it change what you do next? If not, it's observation, not intelligence.
Second, can you intentionally influence it through repeated actions? Can you run tests, optimise campaigns, or adjust operations to move this metric? If you can't act on it, you can't improve it.
Third, can you easily map it to your growth drivers or North Star? Is there a clear, logical connection between this metric and the things that actually grow your business?
If a metric doesn't pass all three, it's almost certainly vanity. The uncomfortable truth from running this exercise across many brands is that around 70% of typical reporting fails the test. If a metric passes one or two questions and you still feel it's valuable, move it to a monthly cadence for context and remove it from daily triage.
A quick illustration: social followers fail (no decisions, hard to map to growth). Pageviews on their own fail (500K pageviews at 0.2% conversion tells you nothing actionable). Conversion rate passes (helps diagnose funnel issues, can be moved through testing). Repeat purchase rate passes (shows whether customers are getting value, directly influences recurring revenue).
Step 2: Platform versus model classification
Once the obvious vanity metrics are gone, go through what's left and ask: does this metric exist because a platform reports it, or because my business model requires it?
Shopify reports conversion rate, orders, sessions and AOV. Meta reports reach, impressions, CPM and CTR. Google and TikTok do the same. You can easily end up with 50 platform metrics without ever asking whether they're the right ones for your business.
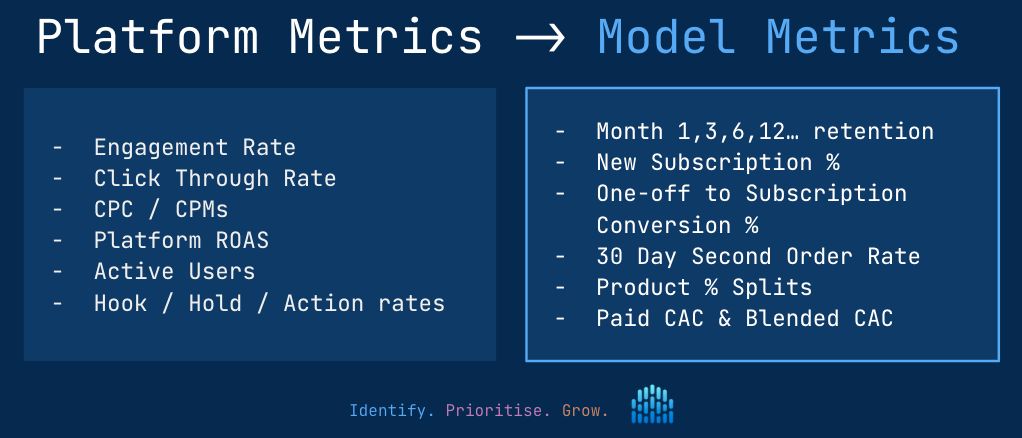
Model-first metrics come from a different place. They come from your forecast or growth model, specifically the assumptions and inputs within it. Things like month-1 and month-6 retention rates, product mix percentages (which materially affect AOV), the proportion of first-time customers choosing subscription versus one-off. These are the metrics that directly affect whether you hit your forecast. Be ruthless here. Default to deletion.
Step 3: Build your metric pyramid
Take what's left and map it into the pyramid structure. Start with your North Star, then identify the 2-4 Key Drivers that mathematically contribute to it, then map 5-7 Growth Levers underneath those drivers.
Once it's built, circulate the diagram. Stick it on the wall, reference it in all-hands, put it in onboarding docs. Every person on the team should know what the North Star is and how their work connects to it. A pyramid that lives only in the founder's head isn't a framework, it's a preference.
Step 4: The decision influence test
For any metric still on your list after the first three steps, ask one final question: when was the last time this metric actually influenced a decision within the team?
If the honest answer is "never" or "can't remember", remove it. I'd push further than the standard advice here. If a metric hasn't been used to make a decision in the past three months, it isn't earning its place. Your dashboard should be triggering action and decision-making, not observation. A dashboard full of metrics nobody acts on is just a screensaver.
Step 5: The 12-metric rule
By this point you should be approaching a list of around 12 metrics or fewer. The test is simple. Can you hold the entire metric set in your head while making decisions? If you can't remember what they all are, you've still got too many and need to cut further.
Going from 40-plus to 12 sounds drastic, and it is. But the impact on decision speed and quality is immediate, and you'll quickly realise when something's missing because you'll need it for a specific decision and won't have it. That's the right time to add a metric back. It's much easier to start lean and fill gaps than to start bloated and try to cut.
Common pitfalls to watch for
A few patterns that derail this exercise.
Confusing "interesting" with "influential". A metric that's interesting to look at, or that was useful six months ago, doesn't earn a daily spot. Default to deletion.
Keeping metrics "just in case". If the only justification is that it might matter in the future, it doesn't matter now. Add it back when a decision actually requires it.
Letting platform defaults drive selection. Just because Shopify, Meta or Google reports a number doesn't mean you need to track it. Start from your model, not from your tools.
What success looks like
When this is working, three things change.
Time to triage drops dramatically. The 60-minute morning dance across six platforms becomes a focused 10-minute review of your 12 core metrics. What's moved, what hasn't, where attention needs to go.
Decision velocity increases. You can identify issues and opportunities faster because you're not wading through noise to find the signal.
Cognitive load decreases. You know exactly what you're trying to influence. You can hold the full picture in your head when you're making decisions, which is when it actually matters.
The real win here isn't tracking fewer metrics to save time. It's tracking fewer metrics to make better decisions, faster. The founder making £400K budget calls shouldn't be spending 21 hours a month reviewing dashboards.
Want help applying this to your brand?
At Crux we build this thinking directly into the reporting and dashboards we create for scaling DTC brands. Rather than dumping every available metric onto a dashboard and calling it analytics, we work backwards from your business model to surface the 12 or so metrics that actually matter for your specific brand, with statistical health monitoring that flags what's urgent versus what's just normal day-to-day fluctuation.
If you're spending too much time on daily triage and want to see what a model-first approach to ecommerce metrics could look like for your business, I'd be happy to have a quick conversation. Drop me a message at matt@gocrux.io.
Analytics and Reporting

