
7th May, 2026

There's a pattern that repeats itself across DTC brands in the £2M to £20M range. Growth is working, up to a point. Revenue climbs through the early years, usually on the back of a strong product and reasonable paid social performance. And then it gets harder. The ROAS on Meta starts softening. The email list doesn't convert the way it used to. The founder or Head of Growth starts testing new channels, new tools, new tactics, chasing whatever seems to be working for other brands. Some of it helps, but most of it doesn't compound.
The diagnosis most operators reach is that they need better data, or better attribution, or more channels. So they do that, and six months later, the same problem remains.
The honest answer is that this is almost never an attribution or channels problem, and rarely a tactics problem. It's a systems problem. The brand doesn't have a repeatable, structured way of turning data into decisions, and decisions into action, at a pace that compounds. This article introduces the framework we use to fix that: a six-component growth system, built in dependency order, that gives brands the infrastructure to grow consistently and measure it properly.
Why the shiny object cycle keeps repeating
The typical response to a growth plateau is to look for what's missing. A new channel, a new tool, a better creative framework. There's nothing wrong with any of these in isolation, but without a system underneath them, they produce one-off lifts rather than compounding improvement.
Here's the test: if your best growth person left tomorrow, how quickly would your growth process break? If the honest answer is "immediately", you don't have a growth system. You have a person doing growth. That's a fragile position, and it's the root cause of the plateau most operators are trying to spend their way out of.
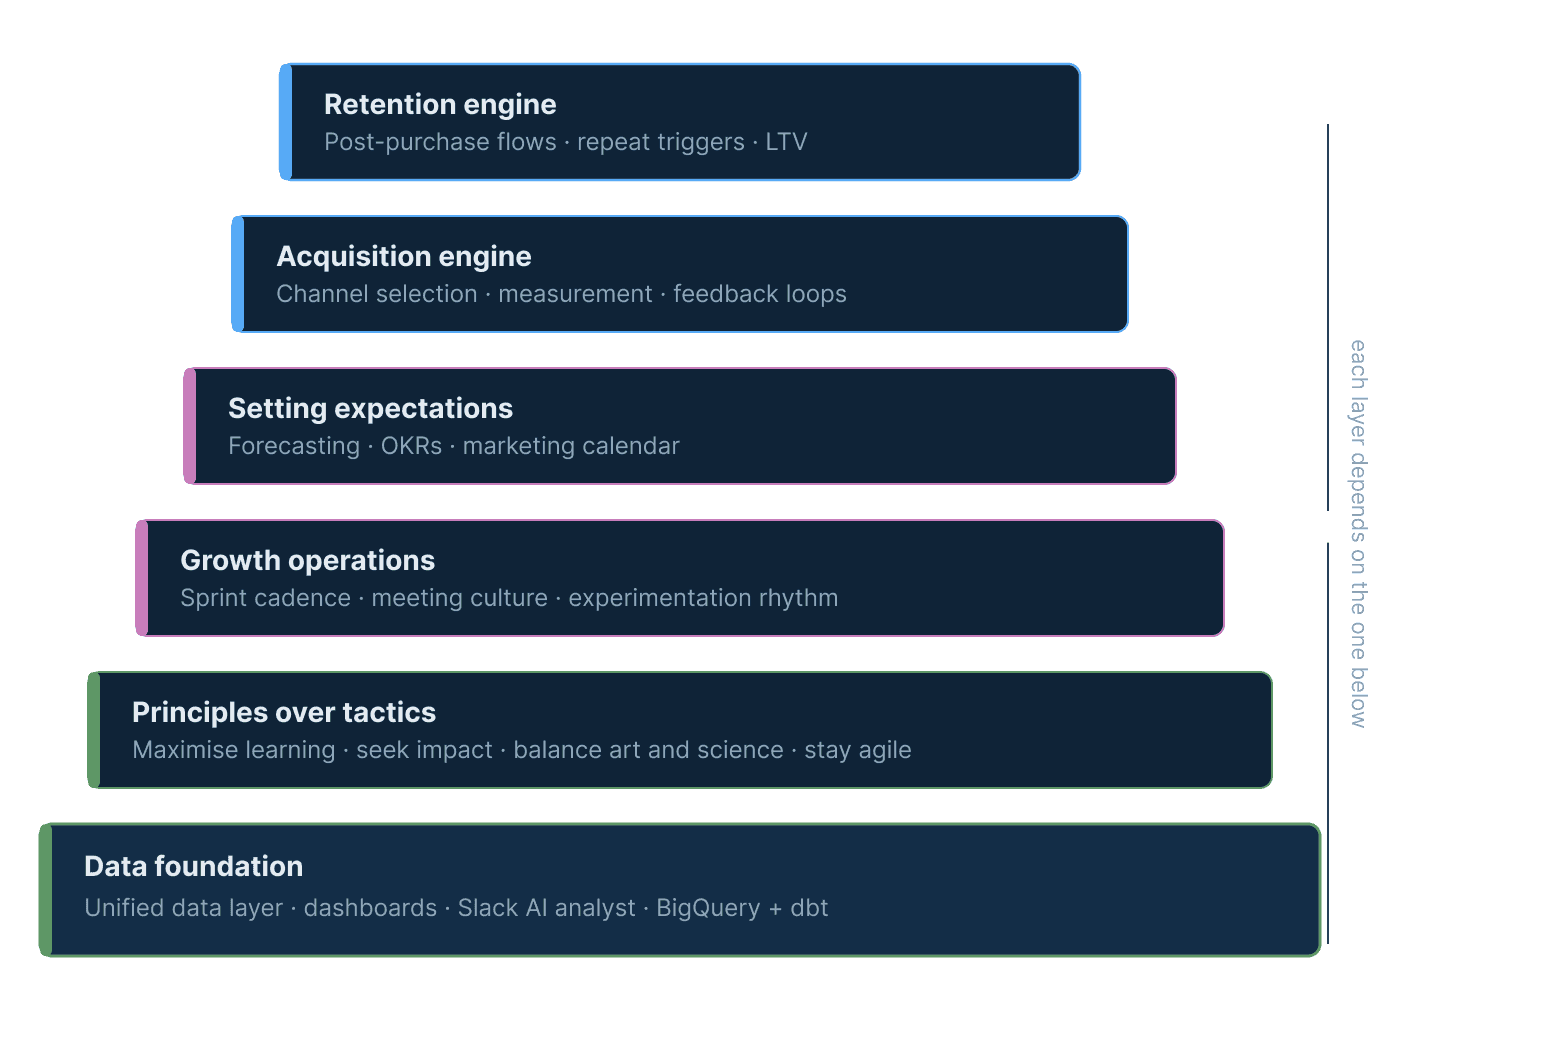
Building a system doesn't mean hiring more people or buying more software. It means creating a structured, repeatable way of operating that any competent person can follow, and that produces better outcomes the longer it runs. The six components below are the building blocks of that system, presented in the order they need to be built.
Component 1: The data foundation
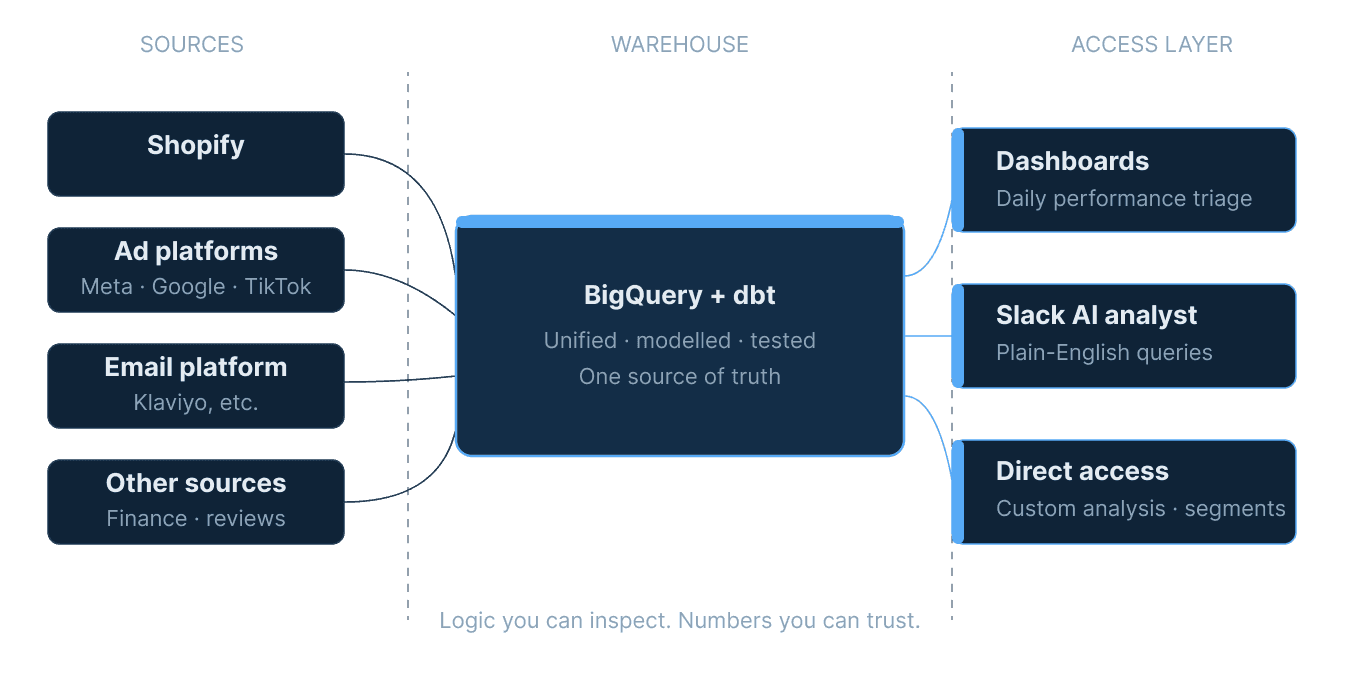
The entire system depends on data you can trust. Not data that lives in five tools and reconciles on a good day, but a single, unified layer where every metric is calculated once, from one source of truth, with logic you can inspect. Revenue is revenue. Contribution margin is contribution margin. LTV is LTV, calculated against your actual cost structure rather than a platform's generic model.
Without this layer, every decision downstream is made on uncertain ground. You might be optimising a channel that looks profitable but isn't, once you apply real COGS and fulfilment costs. You might be missing a retention problem that's been building for six weeks, because the data to spot it doesn't exist in one place. We've spoken to brands paying £2,000+ a month on analytics tools who are still updating a manual spreadsheet every morning because nothing quite agrees with anything else.
The data foundation isn't a dashboard. It's the modelled, tested data layer that sits underneath and powers your whole reporting framework. Get this right and every other component of the system becomes measurable. Get it wrong and the system is built on guesswork.
Component 2: Principles over tactics
Once the data is trustworthy, the next layer is about how decisions get made. Not which tactics to run, but the operating principles that govern how the team approaches every decision.
The four principles we've found most useful across brands at this stage are: maximise learning (every action should generate information, not just output), seek impact (prioritise ruthlessly, not every metric deserves equal attention), balance art and science (data informs decisions but doesn't make them), and stay agile (update plans when the evidence changes, not on a fixed annual cycle). These are built from Brian Balfour's principles from his time at Hubspot.
These might sound abstract written out like that, but their absence is immediately visible in how teams operate. Brands without a "maximise learning" principle run campaigns to hit targets, not to test hypotheses. Brands without a "stay agile" principle stick to a quarterly plan long after the data has told them it's wrong. The principles aren't a values statement; they're an operating constraint that shapes every decision the team makes.
Component 3: Growth operations
With clean data and a set of governing principles, the third layer is how the team actually works. This is the one most operators skip, and it's usually the single biggest drag on growth pace.
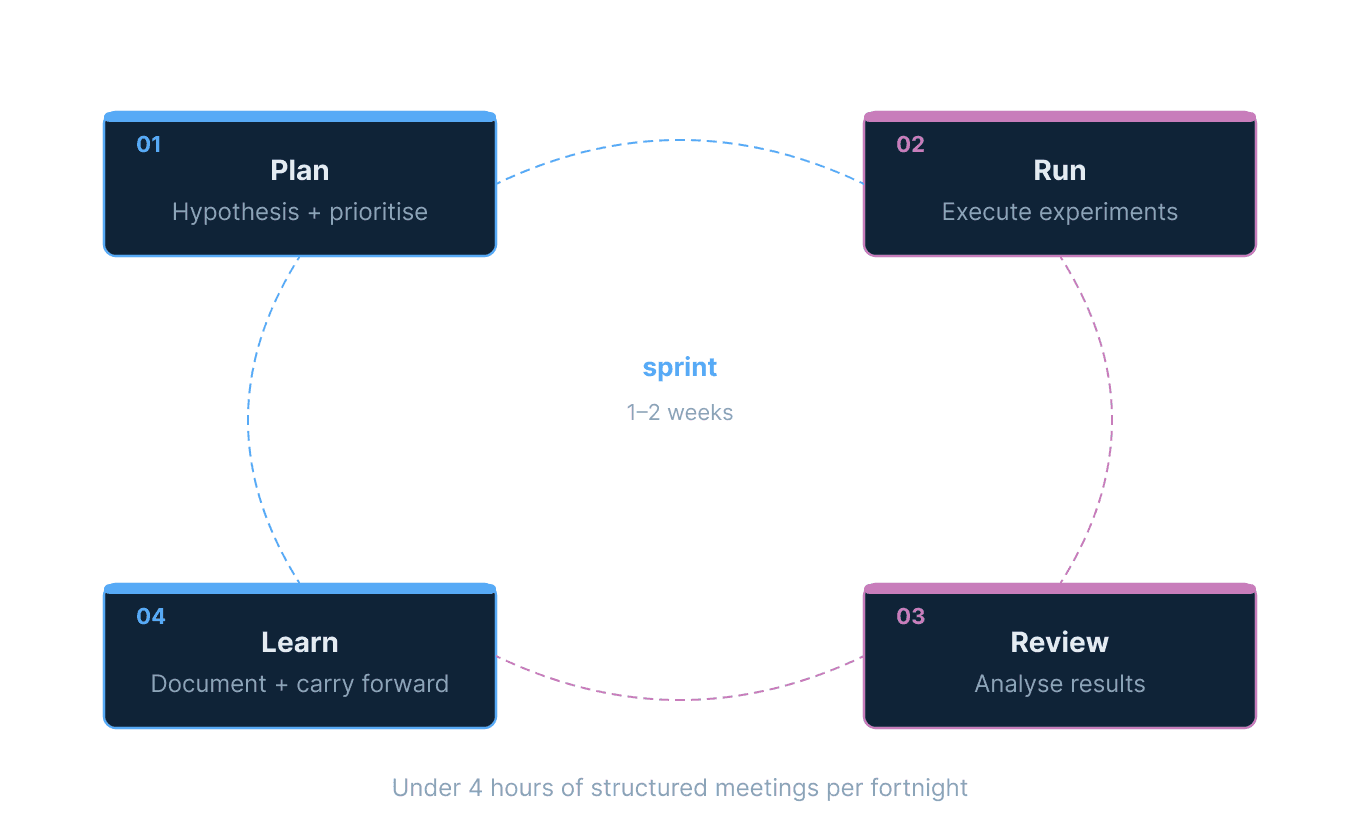
Growth operations covers meeting cadence & hygiene, sprint structure, how experiments get proposed and prioritised, how results get reviewed, and how the learning from one sprint feeds into the next. Without it, growth is sporadic pushes: a burst of activity around a campaign, a lull, another burst. With it, growth becomes a continuous machine: a steady rhythm of hypothesis, test, review, and iteration that compounds over time.
The format we use is a weekly (or bi-weekly) sprint cycle. A short planning session at the start where the team agrees on the two or three highest-impact experiments to run. A mid-sprint check-in using the dashboard to see if anything needs to be killed early. A review session at the end to document what was learned and what carries forward. The whole thing runs in under four hours per fortnight. The value isn't in the meetings; it's in the rhythm.
Component 4: Setting expectations
The fourth component is forecasting, and specifically, connecting a financial forecast to the marketing calendar and growth operations cadence. Most brands either have no forecast or have a spreadsheet with last year's actuals marked up by a percentage and submitted to the board. Neither is operationally useful.
A functional forecast maps expected revenue by day, accounting for the marketing calendar (sale periods, new product launches, seasonal effects), channel contribution, and the experiments running in any given sprint. It gives the team a benchmark against which actual performance is measured, which is what turns the daily dashboard from a reporting exercise into a diagnostic tool. If you're 15% behind forecast in week three of January, the question "why?" has a structured context to be answered in.
Forecasts are also where OKRs connect to the growth system. The targets the team is held to should derive from the forecast (we recommend building 3 levels of forecast), not be set independently of it. When a brand's OKRs are disconnected from the forecast model, you end up in the common situation where a team hits all its activity metrics and misses revenue anyway.
Component 5: The acquisition engine
With the foundations in place, the fifth component is the channel system that brings new customers in. The acquisition engine isn't a media plan; it's a structured approach to channel selection, measurement, and feedback loops.
The key questions the acquisition engine needs to answer are: which channels are genuinely profitable at the customer level (not just at the blended ROAS level), what is the true payback period for each channel given the brand's contribution margin, and how does acquisition quality, measured by the behaviour of acquired customers, feed back into channel decisions? The last question is the one most brands can't answer, because it requires joining acquisition data to retention data at the customer level. That's the data foundation doing its job.
The common failure mode here is optimising for acquisition volume at the expense of acquisition quality. A cohort of customers acquired via heavy discounting may have a 30-day repeat rate that's half that of a cohort acquired via organic search. If you can't see that in the data, you'll keep buying the cheaper-looking customers and wondering why retention is hard.
Component 6: The retention engine
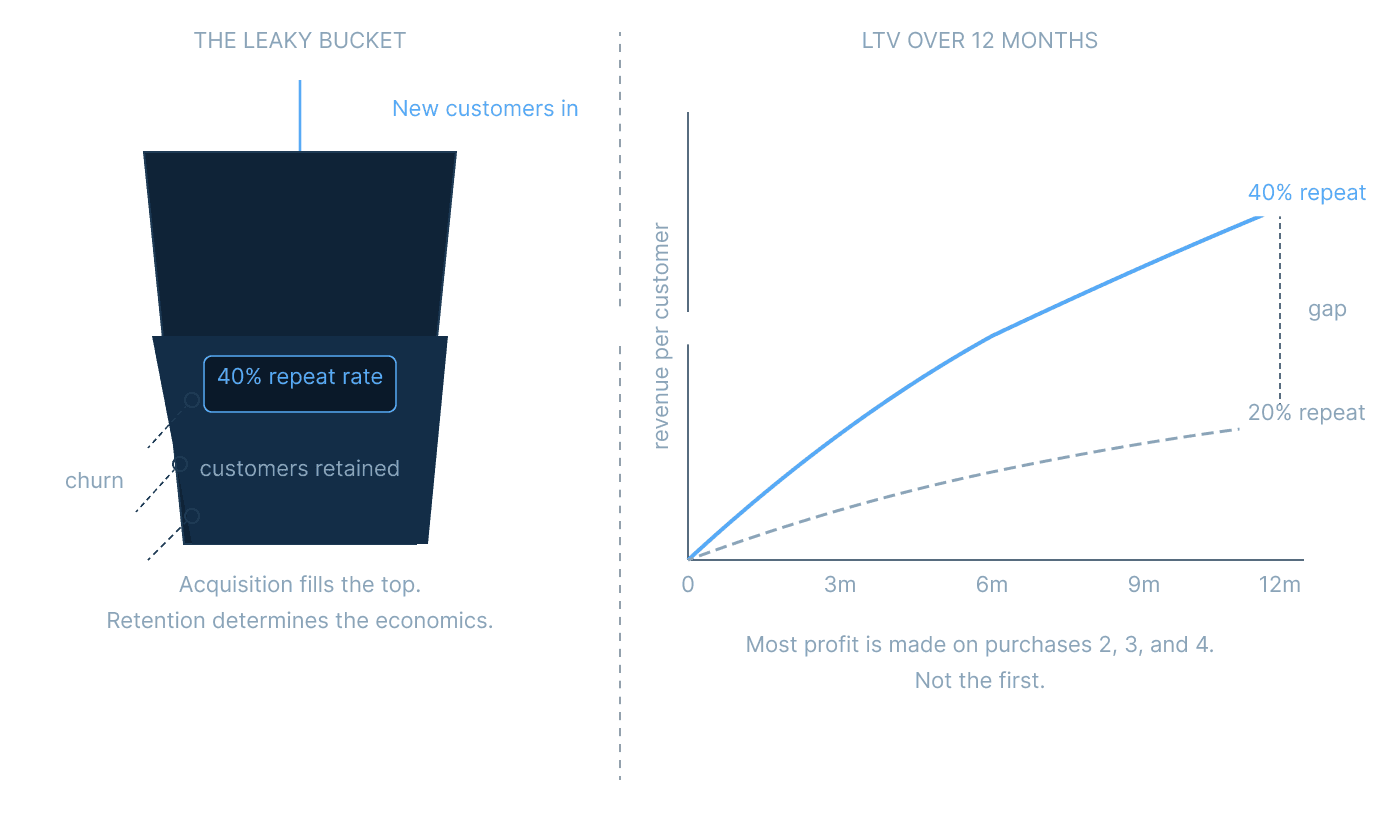
The retention engine is the last component and the highest-leverage one. At the £2M to £20M stage, most of a brand's profit is made on the second, third, and fourth purchase, not the first. The acquisition engine fills the top of the funnel; the retention engine determines whether the economics work.
The retention engine covers post-purchase flows, subscription mechanics (where relevant), repeat purchase triggers, qualitative feedback loops, and the signals that indicate a customer is at risk of lapsing. The specific tactics vary enormously by category, but the structural requirement is the same across all of them: you need to know who your best customers are, what made them that way, and how to find more of them.
This is also where the data foundation pays back most clearly. Questions like "what is our 90-day repeat rate by acquisition channel?" or "which product categories have the highest second-purchase rate?" are straightforward to answer with a properly modelled data layer. Without it, you're making retention decisions based on platform-level aggregates that hide the variance that actually matters.
Why the order matters
The dependency logic of the six components is worth making explicit. You cannot build a meaningful retention engine without customers acquired through a functioning acquisition engine. You cannot run (you can be you shouldn’t) that acquisition engine without a forecast to measure it against. You cannot build a forecast without growth operations (a functioning sprint cadence and review process) to keep it honest. None of that is possible without governing principles to guide how decisions get made. And the whole thing collapses without clean data underneath.
This isn't theoretical. When we've worked with brands that have tried to skip ahead, building a retention programme before fixing the data layer, or running agile sprints without a proper measurement cadence, the result is always the same: a lot of activity with very little learning. The system only compounds when the foundations are solid.
During scaling Fussy from £2.2M to £20M+, the components that had to be built first were always the unglamorous ones. The data layer. The sprint rhythm. The forecast. The more visible work, the acquisition and retention tactics, only started to compound once those foundations were in place.
What it looks like when the system is working
When all six components are functioning, the day-to-day experience of running growth changes in three concrete ways. First, the daily triage becomes faster. Instead of pulling numbers from five platforms and hoping they agree, you open one dashboard with pre-tested metrics and spend the first ten minutes of the day understanding what happened, not gathering it. Second, decisions have a clear process. A new channel, a new tactic, a budget reallocation: all of these go through the same sprint-based evaluation cycle, which means the team isn't constantly context-switching or chasing the latest trend. Third, learning compounds. The review session at the end of each sprint adds to a documented body of knowledge about what works for this specific brand, in this specific category, with this specific customer base. After six months of consistent operation, that institutional knowledge is genuinely valuable and very hard for a competitor to replicate.
Analytics and Reporting

