
8 December, 2025
The 7 minute triage process to know which metrics need your attention TODAY
Stop wasting 45 minutes each morning trying to figure out if your [insert key Shopify metric here] drop is normal.
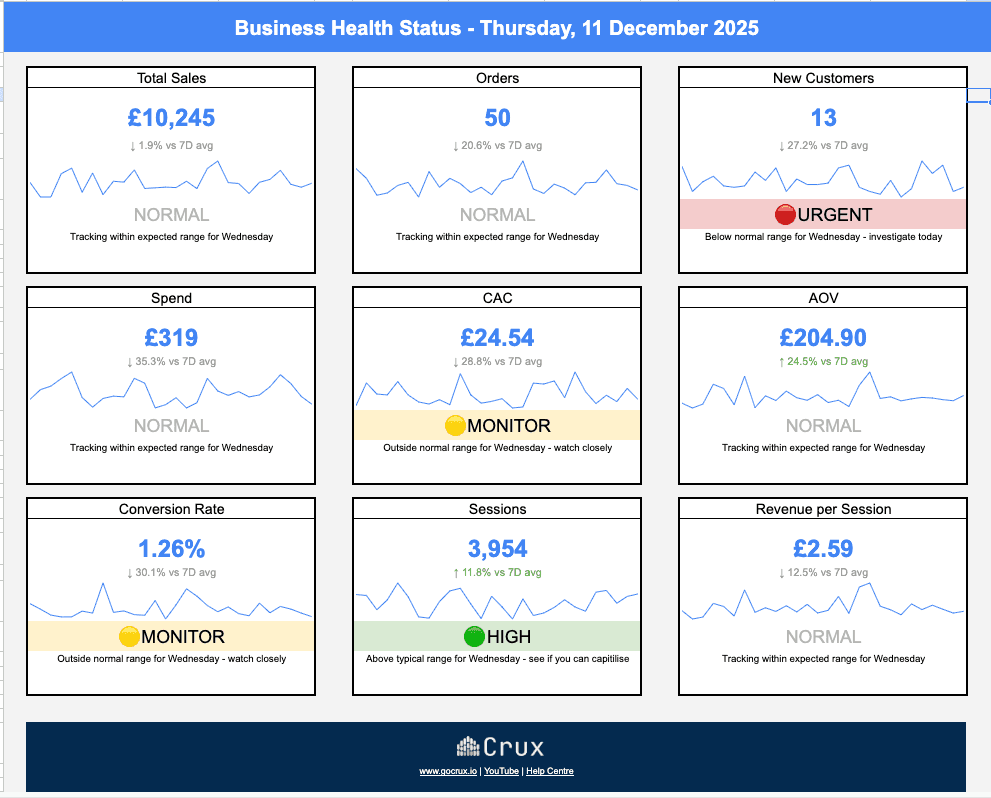
The Business Triage Dashboard compares today's performance to 8 weeks of the same day-of-week and instantly shows you what's healthy (🟢), what to monitor (🟡) and what's urgent (🔴).
One glance tells you if you've got a real problem or just a normal Wednesday.
Features
Day-of-week seasonality built-in
8 weeks of statistical baselines
Daily updates in under 7 minutes
Know what's urgent vs. what's noise
Checklist for investigating 'Urgent' metrics
Every morning, you face the same dilemma: revenue is down 12%, but is that actually a problem? Most operators waste 45+ minutes checking ads, emails, and analytics, only to discover it's just "normal for Wednesday."
The Business Triage Dashboard solves this by comparing yesterday's metrics against 8 weeks of the same day-of-week, using statistical thresholds to instantly tell you if a fluctuation is healthy variance (🟢), worth monitoring (🟡), or urgent (🔴).
Instead of second-guessing every drop, you get a definitive answer in a 60 second scan. So you can focus on actual problems, not phantom ones.
Analytics and Reporting

